Basic Functions and commands of MATLAB:
Task # 1 Investigate the effect of the following commands.
(i) a(2)
(ii) sum =a+b
(iii) diff =a-b
(iv) ab=[ a b]
(v) ab(2:6)
(vi) a`
CODE
a=[2 4, 7 5];
b=[1 3, 8 9];
%i
a(2)
%ii
sum = a+b
%iii
diff = a-b
%iv
ab = [a b]
%v
ab(2:6)
OUTPUT
ans =
b=[1 3, 8 9];
%i
a(2)
%ii
sum = a+b
%iii
diff = a-b
%iv
ab = [a b]
%v
ab(2:6)
OUTPUT
ans =
4
sum =
3 7 15 14
diff =
1 1 -1 -4
ab =
2 4 7 5 1 3 8 9
ans =
4 7 5 1 3
TASK # 2: Investigate the effect of the following commands.
(i) z'
(ii) z*a
(iii) a * z
(iv) [a;b]
(v) [z; a']
(vi) z+a'
MATLAB CODE
a=[2 4 7 5];
b=[1 3 8 9];
z=[1; 1; 0; 0];
% i
z'
% ii
z*a
% iii
a * z
% iv
[a;b]
% v
[z; a']
% vi
z+a'
b=[1 3 8 9];
z=[1; 1; 0; 0];
% i
z'
% ii
z*a
% iii
a * z
% iv
[a;b]
% v
[z; a']
% vi
z+a'
OUTPUT
% i
ans =
1 1 0 0
% ii
ans =
2 4 7 5
2 4 7 5
0 0 0 0
0 0 0 0
% iii
ans =
6
% iv
ans =
2 4 7 5
1 3 8 9
%v
ans =
1
1
0
0
2
4
7
5
% vi
ans =
3
5
7
5
ans =
1 1 0 0
% ii
ans =
2 4 7 5
2 4 7 5
0 0 0 0
0 0 0 0
% iii
ans =
6
% iv
ans =
2 4 7 5
1 3 8 9
%v
ans =
1
1
0
0
2
4
7
5
% vi
ans =
3
5
7
5
Task # 3: Investigate the effect of the following commands.
(i) N=inv(M)
(ii) M*N
(iii) I=eye(2)
(iv) M+I
(v) M*z(1:2)
(vi) a(3:4)*M
(vii) M(1:2, 1:2)
(ix) M(:, 1)
(x) M(2,:)
CODE
M=[1 2; 3 4];
%i
N=inv(M)
%ii
M*N
%iii
I=eye(2)
%iv
M+I
%v
z=[1; 1; 0; 0];
M*z(1:2)
%vi
a=[2 4 7 5];
a(3:4)*M
%vii
M(1:2, 1:2)
%ix
M(:, 1)
%x
M(2,:)
OUPUT
N =
-2.0000 1.0000
1.5000 -0.5000
ans =
1.0000 0
0.0000 1.0000
I =
1 0
0 1
ans =
2 2
3 5
ans =
3
7
ans =
22 34
ans =
1 2
3 4
ans =
1
3
ans =
3 4
TASK # 4: Use the help command to find out about the following built-in functions and make up your own simple examples:
1: Ones
2: Zeros
3: det
4: Linspace
5: logspace
CODE + OUTPUT


TASK # 5:
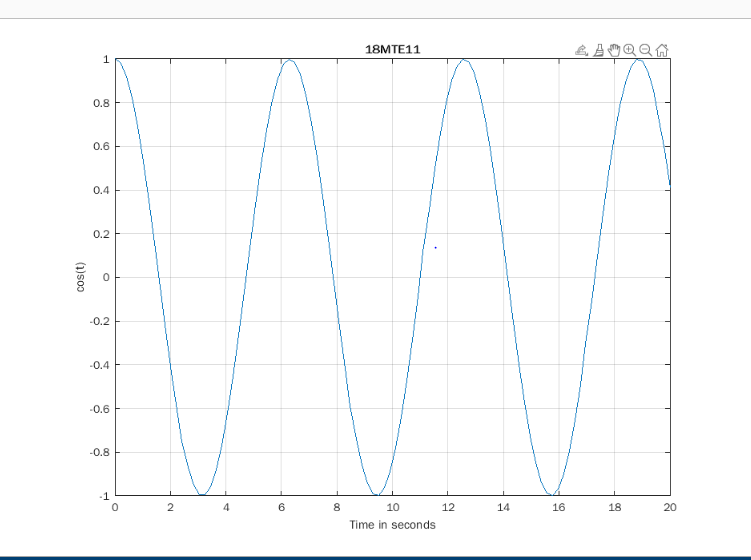
1. Generate a vector yc containing the values of cos(t) for the same time range as before.
1. Generate a vector yc containing the values of cos(t) for the same time range as before.
2. From the "help" entry for "plot" find out how to get both ys and yc plotted against t on the same axis.
3. From the "help" entry for "subplot" find out how to plot ys and yc plotted on two separate graphs, one above the other.
CODE # 1

CODE # 2


CODE # 3


Comments
Post a Comment